New Housing Ownership Models: Divvy Homes
Over the past few years, as pronounced demand against constrained supply has produced outsized home price appreciation relative to wage growth, a host of venture-backed companies have emerged to address housing affordability, some offering novel solutions. This series aims to provide a look beneath the corporate veneer to discern which firms create value for users, investors, and society. Why society? Most of these firms purport to advance a social mission.
Per its website, Divvy Homes is "…in the business of financial equality." It is a variation on the classic rent-to-own model whereby instead of buying a home outright today, a user (“User”) can occupy said home as a renter today, and purchase it from Divvy in < 3 years, by which point User should have saved ~10% of the home’s value. What distinguishes Divvy from prior variants of this model is that Divvy isn’t selling run down homes purchased at foreclosure auctions while committing renters to cover code compliance required repairs and back taxes. Divvy buys the home of a user’s choice and, since it may end up owning and selling the asset to someone else, its interests are aligned with those of the user in terms of selecting a home that presents good value and limited capital needs.
How it Works: After a qualification process in which Divvy assesses how much home it would buy for User (predicated on credit, income level, location), User can then shop for a house or condo. Divvy touts its AI approach to credit assessment, which could enable it to identify credit-challenged users who, low FICO notwithstanding, present favorable credit risk. Divvy buys the home, with User contributing 1-2% of the purchase price (goes toward it’s savings account). User enters a three year lease and forward purchase agreement with Divvy, during which it may purchase the home at a pre-negotiated price (“PP”).
Unlike in a traditional rental agreement, wherein the landlord bears responsibility for repairs and maintenance, Divvy only covers the “…cost of any maintenance or repairs required to ensure the home is safe and habitable - for example, roofing, HVAC, foundation, electrical systems, etc.” It delegates what it deems “cosmetic repairs” (“…including but not limited to painting, carpeting, landscaping, or appliances.”) to the user.
About 25% of User’s monthly payment (the balance being market rent) goes toward its savings account (rather than it being invested in home equity), although this capital is at-risk in the event of declining home values. Since Divvy doesn’t specify an interest rate, we will assume users earn market rates of interest (< 1%). If User decides not to buy at the predetermined price (“PP”), User gets back its savings net of a "relisting" fee (2% of home value plus other fees) and Divvy “…may choose to assess a Shared Loss Deduction to the tenant to help allocate some of the downside of home price depreciation.”
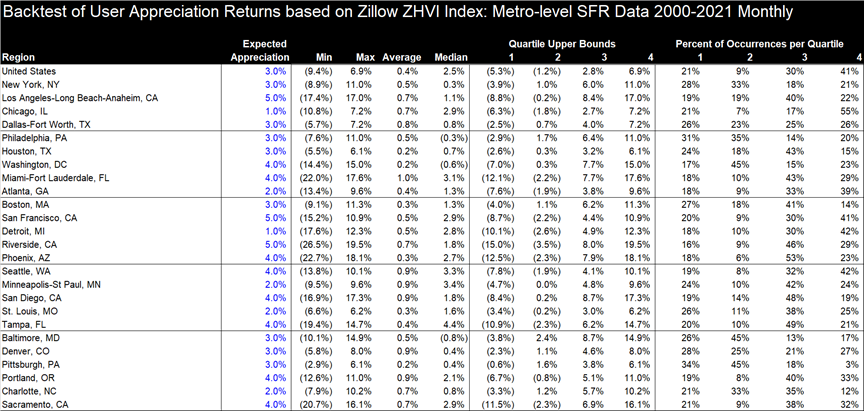
The above is an attempt to quantify the expected appreciation returns to users of Divvy. While the forced-savings account Divvy helps users to accrue does not earn equity returns, users are contractually bound by a forward to purchase, and if the spot price exceeds their contractual price, they enjoy the appreciation overage. If the contract price exceeds the spot price, and users still close, Divvy has successfully hedged.
Methodology: First I ran three-year CAGRs on monthly SFR data back to Jan 2000. I assumed each sale takes place at lease expiry (T = 3). I assumed Divvy would choose as its predetermined forward price, the T = 0 market price grown by the truncated arithmetic average (“TAA”) for each respective MSA. For each monthly CAGR calc, if it exceeds TAA, a user buying in this month captures the overage, buying the home for < spot price. If 3Y CAGR < TAA, a user either overpays (if a lender will finance home at an inflated price) or bears penalties of equivalent severity.
Divvy does not specify whether it would use its 'shared loss deduction' lever only if values decline, versus fall short of its expected appreciation. We assume it will use SLD to attempt to incent users to take Divvy's loss although practicalities around financing and user wherewithal will limit efficacy.
Source: Zillow ZHVI Index: Metro-level SFR Data (Jan 2000 - Sept 2021). Represents “typical home value for each region.
While Divvy does not claim User will enjoy returns from appreciation over its 3 year lease, if the spot price of the home ≠ Divvy’s predetermined sale price, home value appreciation (wealth) is being transferred between the counterparties. Presuming User is solely optimizing around this decision, and isn’t trying to predict the direction of future prices, when (at exit) three-year appreciation has exceeded Divvy’s projection (i.e., spot price > Divvy’s PP), User buys and captures the overage. When the spot price < PP, Divvy will use its relisting fee stack and possibly its ‘shared loss deduction’ lever to compel User to hedge Divvy’s downside. E.g., if Divvy assumes 3% appreciation and the home appreciates at 5%/annum, User enjoys 5-3 = 2% appreciation per annum by purchasing at PP. If values fall 5% per annum for 3 years, with Divvy expecting the same 3% CAGR, User could buy at PP (28% above spot price) or forfeit its initial investment (relisting fee), and trigger Divvy’s nebulous ‘shared loss deduction.’ The exhibit to the right explores this empirically. Whereas average appreciation to User, which depends on Divvy’s predetermined rate of appreciation and how aggressively it utilizes its ‘relisting’ fee and ‘shared loss deduction’ tools to impel User to buy, is between 0% and 1% across MSAs, the range of outcomes averages 25% across metros, with the worst user outcomes in 15 of the 25 metros involving double-digit losses per annum for three years. Despite the lease and savings account structure, User has capital at risk, with downside not explicitly capped at User’s accrued savings.
Value for Users: The narrow advantage Divvy offers vs. renting a home and saving conventionally, is not in affordability but immediacy, which can matter for parents trying to enable kids to attend schools in districts without available rental product (RTO can eliminate the costs of moving twice also). In addition to the non-trivial downside risk described above, by tying up its savings, User is unable to earn the superior expected rates of return available across asset classes. Divvy’s sole and marginal financial benefit is its forced savings mechanism, whereas relative to conventional renting & saving, User pays a greater share of OPEX, bears the asymmetric trade mentioned above, and is forced to underinvest it’s savings.
In aggregate, Divvy’s offering seems valuable to a narrow set of prospective home buyers who either value instant gratification or have a real need to live in a particular neighborhood in which they cannot temporarily rent. While its differentiated credit assessment methods may expand the set of prospective residents able to qualify for its product, for this to entail a net positive, Divvy’s product must first create meaningful value for users.
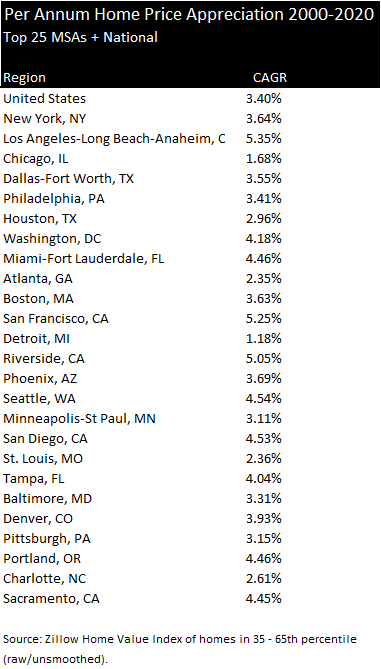
The median growth rate amongst the top 25 MSAs is 3.6%. Note that results are base year sensitive. See Key analysis for more extensive exploration of appreciation rates.
Impact / Value for Society: The impact or virtue of this tool for "financial equality" is predicated on the belief that homeownership is best for everyone, and that it is an inherently favorable investment. Homeownership is best for those who are able to remain in one area for 10+ years (high transaction costs), have sufficient stability and income to limit default risk, and who value the freedom to tailor their surroundings unimpeded. It is certainly not best for all regardless of credit and income profile, a lesson we learned in the GFC. In terms of its value as an investment, homeownership is a consumption good vs. an investment. To make that point, Charlie Munger famously told a young Berkshire Hathaway investor seeking a investor’s perspective on when to purchase a home that you “…need one [a home] when your wife wants one.”
That homeownership is uniformly financially superior to renting (tantamount to “throwing away money”) is specious common knowledge that I suspect traces back to national mortgage subsidy programs post WWII as well as cultural factors. When conducting a thorough discounted cash flow analysis of home ownership that factors in the rent one avoids by owning, the incremental OPEX and CAPEX one must cover, obsolescence, the cost of debt, tax advantages and the opportunity cost of one's down payment, justifying homeownership financially requires assuming markedly high rates of appreciation (or high rents relative to home prices). If purchasing in the San Francisco MSA wherein appreciation has exceeded a 5% CAGR since the 1970s, and one can acquire conviction that the trend will continue, the numbers can work. However, growth is base year sensitive; one’s holding period CAGR will vary greatly based on buying at the peak vs. the trough of the cycle.
Whereas home values have performed well in supply constrained markets during periods of pronounced growth, in less propitious times or less supply constrained markets, prices are correlated to construction costs net of obsolescence. Also, the data in the inset does not account for what homeowners spent on OPEX or CAPEX, or whether the 35th - 65% percentile band represented larger or better located homes in 2020 vs. 2000.
If homeownership-for-all is virtuous, Divvy doesn't address affordability, just immediacy, and then not in terms of helping users to save more rapidly through compounding, but by simply requiring them to save more in a savings account that is at-risk in the event of home price declines. The set of prospective home buyers who have a real need to live in a particular neighborhood in which they cannot temporarily rent is not a wide swathe of overall demand, and I would hardly consider enabling the instant gratification of those who just want a home now because they want it to be social impact. The model and its implications fall somewhat short of revolutionary.
Value for Investors: Divvy claims to make its money by charging the renter market rate and then by selling the home at a pre-negotiated price. If so, the unlevered returns to its real estate portfolio should fall in a similar range as those of INVH and other SFR investors. Divvy’s allocating of R&M, turn costs & landscaping to tenants will be offset by its less efficient, disparate mapping to markets and lesser scale. Divvy’s main disadvantage to INVH is that INVH can select homes purely to maximize returns and has the flexibility to sell when conditions are optimal, ideally after a longer term hold to generate more return from cash flow and reduce per annum transaction costs.
Divvy’s deal structure with Users appears designed to reduce volatility (like buying a put from and writing a call to the user), but its ‘put option’ entails counterparty risk. Divvy’s contractual ability to assess a ‘shared loss deduction’ could encourage the marginal user to absorb Divvy’s home price declines, but 1), the balance sheets of cash-poor first-time homebuyers are likely inadequate to hedge Divvy’s downside, 2), attempting to offload risk onto the financially vulnerable could be a death knell for Divvy’s image and user growth, and 3) I’m not sure how Divvy convinces a lender to e.g., finance a $270k home at a $300k sales price. The exit timing rigidity of the RTO model places Divvy at a performance disadvantage to investors with the ability to hold through market dislocations.
Divvy’s advantages over INVH include that of day-one rental cashflow upon acquisition and balance sheet flexibility. Divvy collects rental cash flow on acquisitions immediately versus having to spend a few weeks leasing the home post purchase and renovation, but this advantage is de minimis over a 3-5 year hold. Divvy, unconstrained by REIT rules, could carry higher leverage, but that would not reflect model superiority so much as excess risk.
In terms of incremental risks, Divvy’s short hold period increases its exposure to high volatility SFR prices, the bulk of returns deriving therefrom. According to Unison’s research, the average annualized volatility of a single home was 15% over 2000-19. This means there is a 16% chance of a value decline in excess of 15% in a given year, enough to wipe out a user’s position. Three-year holds will entail a wider range of return outcomes. If prices decline materially or users face a volatile period of dislocation, uncertainty may reduce Divvy’s ability to compel users to buy even if Divvy’s breakup fees exceed the spot vs. contractual price delta. Lenders will be on high alert and may reduce max leverage, and buyers are loathe to try to catch a falling knife. Divvy’s fee stack may reduce downside, but cash poor buyers can’t absorb a 5-10% price correction, and the bad press could damage Divvy’s marketing. When Divvy cannot sell to the user, the odds increase that it will need to incur 7-10% transaction costs for a conventional exit (or maintain an efficient marketplace for owned inventory, which would require substantial scale).
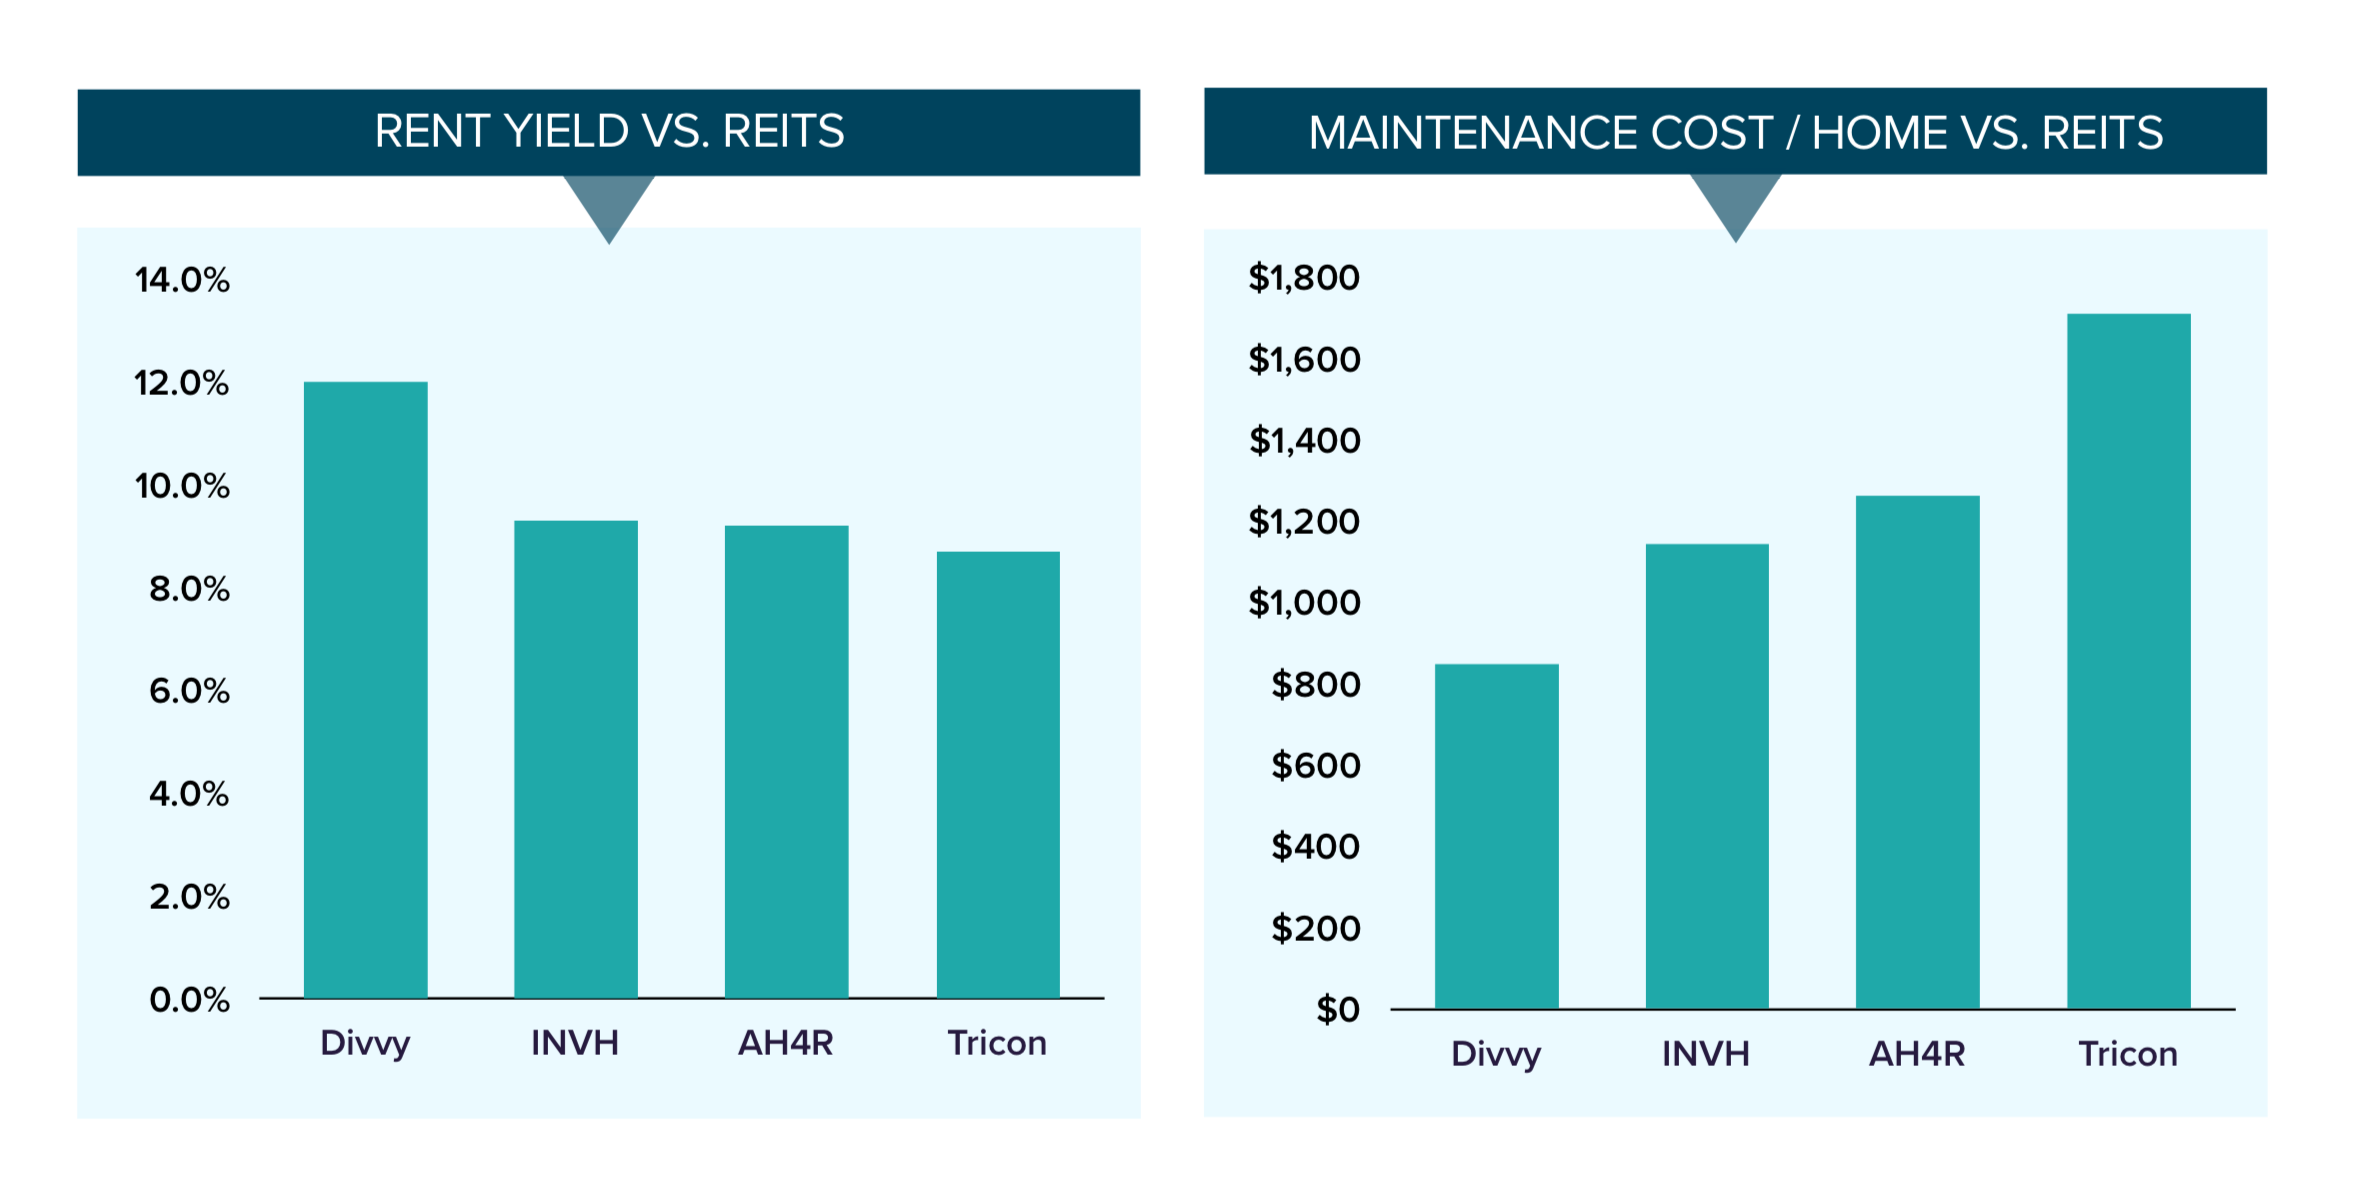
Higher rental yields reflect Divvy’s presence in higher yield (lower growth) markets, which also generally have lower labor & materials costs (in addition to its shifting of R&M, turnover, and landscaping costs to the user). Source: https://a16z.com/2020/02/10/a-novel-path-to-homeownership/
The inset bar charts are from an a16z briefing on the Divvy thesis, in which a16z uses rental yield and R&M costs as demonstrative of its superior profitability. Rental yield isn’t a total return measure, limiting its utility as a basis for comparison across geographies or strategies. Divvy’s rental yield premium is a reflection of the lower growth, high yield markets in which it invests in addition to any OPEX advantages. Market selection also contributes to Divvy’s lower R&M. Net net, I would expect capital invested in Divvy’s PropCo to underperform capital invested in INVH (excluding any hidden fees and on a leverage neutral basis).
Conclusion: Divvy appears to derive from the classic “rent-to-own” model sans the deceptive elements. While I appreciate the clarity of its model, I don’t consider it “social impact” or revolutionary. Divvy’s product appears superior for a very narrow use case in which a user must own vs. rent in neighborhood X for qualitative, non-financial reasons. Scalability will be limited by the breadth of the market for which Divvy creates value, and Divvy’s ability to prove out its value to users by converting renters into owners. Declining home prices may prove a challenging test for the model given its exit timing rigidity. Amassing pension fund or endowment capital to buy homes would be difficult if my assessment that its returns are probabilistically likely to underperform the SFR rental model, albeit with higher credit risk, is correct.
***
Certain information contained in here has been obtained from third-party sources. While taken from sources believed to be reliable, Rampart Ridge, LLC has not independently verified such information and makes no representations about the enduring accuracy of the information or its appropriateness for a given situation.
This content is provided for informational purposes only, and should not be relied upon as legal, business, investment, or tax advice. You should consult your own advisers as to those matters. References to any securities or digital assets are for illustrative purposes only, and do not constitute an investment recommendation or offer to provide investment advisory services. Furthermore, this content is not directed at nor intended for use by any investors or prospective investors, and may not under any circumstances be relied upon when making a decision to invest in any fund managed by Rampart Ridge, LLC. (An offering to invest in a Rampart Ridge, LLC fund will be made only by the private placement memorandum, subscription agreement, and other relevant documentation of any such fund and should be read in their entirety.)
Charts and graphs provided within are for informational purposes solely and should not be relied upon when making any investment decision. Past performance is not indicative of future results. The content speaks only as of the date indicated. Any projections, estimates, forecasts, targets, prospects, and/or opinions expressed in these materials are subject to change without notice and may differ or be contrary to opinions expressed by others.