Key: Unlocking Homeownership
Over the past few years, as pronounced demand against constrained supply has produced outsized home price appreciation relative to wage growth, a host of venture-backed companies have emerged to address the path to homeownership. This series aims to provide a look beneath the corporate veneer to discern which firms create value for consumers, property owners, investors, and society. Why society? Most of these firms purport to advance a social mission.
Key is a Toronto-based start-up that offers a novel solution through a model with similarities to rent-to-own (“RTO”) but with several points of distinction, including multiple distinct paths to revenue. Whereas historically, RTO operators have purchased homes with physical or title defects as inventory to pass along to unsuspecting renters (at a marked-up price), Key attaches to new or recently developed product that it sells to residents at market. Whereas RTOs might seek to earn market rent and harness the renter with an above-market share of OPEX plus fees, Key charges residents market rent in a NNN lease structure that simulates the risk and cost exposures of ownership, with transaction costs limited to 1% of equity. With RTO, consumers build a ‘savings account’, wherein the interest rate applied to their ‘equity’ is not correlated with their home’s equity appreciation rate. RTO renters have a fixed period in which to qualify for a mortgage, often being subject to exorbitant fees if they don’t ultimately purchase. RTO was designed for investors, whereas Key aligns the interests of investors and residents.
The offering to prospective residents combines the primary characteristics of ownership (e.g., the ability to participate in home equity appreciation, fixed finance costs for three-year terms, security of occupancy, ability to customize) with the attractive qualities of renting (mobility, greater control over asset allocation, low transaction costs). At Key, according to their percent equity contribution, residents become their own landlords, making renovation decisions, and sharing in repairs & maintenance pro-rata, while investing alongside a PropCo compensated in part by long-term appreciation.
Key’s residents are likely to be of distinctly higher credit quality, turn over less frequently, and express loyalty to Key when they do. Its residents likely have good jobs but lack down payments. They may have rented a for-sale condominium or a single-family home rather than a purpose-built rental multi-family unit (“PBR”), desiring higher-end finishes and locations, and to live in communities of owners. Uniquely, Key’s residents own equity and pay OPEX directly, incentivizing them to minimize it. With residents already enjoying many of the benefits of ownership and signing three-year initial contracts that they extend in three-year terms, turnover should be lower than for PBRs. If it does its job well, Key residents moving between major cities, having experienced ownership, may be more likely to choose a frictionless move into a unique Key-powered community than are the residents of urban apartment REITs to move within the REITs holdings. Key’s offering is differentiated and should be stickier than the commodity class A.
Sec 1: How it Works for Owner-Residents
The purchase process begins with a prospective Owner-Resident (“OR”) selecting a condo in a Key-attached building regarding which it desires to enter a forward purchase agreement. If the home is $1m in value, it must invest a minimum of 2.5%, i.e., $25k, in the form of a deposit, alongside the investor’s $475k. This $500k is matched with 1x debt at interest rates inside of those available to consumers. The purchase process can be completed in 15 minutes on a phone, which is worthy of celebration in terms of ease and reversibility (transaction costs being 1% on OR’s equity stake).
The OR rents the percentage of the condo or home that it doesn’t own, while enjoying ownership benefits and responsibilities that closely model homeownership on the percentage it owns. The OR’s deposit functions like an equity investment in the condo, earning total returns on this position on a pro-rata basis. Whereas a conventional apartment lease exposes the renter to rental rate inflation but insulates it from changes in OPEX (sans utilities), Key forward purchase agreements are fixed for three years in a triple net (“NNN”) structure that provides ORs with responsibility for OPEX (repairs & maintenance is shared pro-rata) and concomitant growth, a structure that simulates the risk exposures of homeownership, although it does not provide its corresponding tax benefits. The OR may expand its equity stake at will (subject to a monthly AVM & a 100bp fee) and a planned low-cost equity line of credit would allow the OR to draw against its investment. Of the OR’s NNN rent payment, $50 is invested in its equity stake each month. Economically, it’s a pari passu deal with the investor, with the structure being a forward purchase / lease.
Rights to purchase or sell change over the OR’s sequence of agreements. During the first term, the OR is not allowed to purchase nor is the investor allowed to sell. Thereafter, and after providing 75 days’ notice, the OR may buy 100% of the home at current, appraiser-determined value. With six months’ notice the investor may sell, with the OR getting the first right to purchase, Key and its affiliated PropCos getting the second, and the price being fair market value (adjusted by a certified appraiser to account for renovations and damages). The OR has a right to remain as a tenant unless the new owner occupies. Forcing an OR to move to another Key unit in 3.5 years versus the six to nine necessary to accrue a down payment could produce OR turnover and frustration, but if the OR is able to move within the same building or community, with Key smoothing the transition logistically and financially, not necessarily.
The rental process begins with Key surveying the market to determine market rent, and in the absence of historical OPEX data, setting OPEX to 35% of market rent, a reasonable starting point. This OPEX ratio determines the “rent equivalent” NNN payment (market rent*(1 - OPEX Ratio)) that goes to investors. If Key’s OPEX estimate is too high, the rent equivalent it receives is too low, with the resident making payments to a separate condo association and covering property taxes, insurance, and its pro-rata share of in-unit maintenance separately (OR wins). If Key’s OPEX estimate is too low, NNN rent + OPEX > market rent, and the OR may exit upon 75 days’ notice without incurring a lease break fee. Key’s building OPEX history dataset, which will quickly grow with it, will enable it to predict and set reasonable OPEX with increasing accuracy to prevent mispricing-based turnover.
As an example, let’s assume an OR named Margot co-owns a home that would rent for $3,000 at market. Her OPEX allocation is $3,000 x 35% = $1,050, with her rent equivalent being $1,950. Fifty dollars of this rent equivalent is invested (by Key), at her home’s current AVM-generated valuation, into her equity account monthly. Margot, owning 10% of the home, receives a credit for $195 / month, a figure that will be incrementally higher next month due to the equity she purchased at her home’s current valuation (both the $50 noted above plus an extra $100 she is investing at her discretion). Margot covers payments to her condo association and covers property tax, insurance, and interior repairs & maintenance in amounts that are on average, equivalent to the OPEX implied by the OPEX ratio. Margot’s home being financed with 50% debt, she also pays debt service pro rata. All payments flow through Key’s app.
PropCos participate pro-rata in HOA special assessments for larger, unexpected capital events, enhancing interest alignment. The recent collapse of an under-maintained, ill-designed condo tower in Miami underscores the importance of due diligence at acquisition, and the game-theoretic challenge of funding large, necessary capital items through a democratic process. Key-attached PropCos are purchasing blocks of largely < 10-year-old condo product they will hold long term. They are incentivized to perform thorough due diligence on developer reputation and the physical plant. Controlling a large block of condo association votes, Key can tilt the scales towards prudent maintenance and CAPEX despite elevated costs in the short run, a tradeoff that has proven difficult for bodies of disparate homeowners.
Key handles payment default through a discretionary process that acknowledges the financial reality of many of its ORs, which choose Key because of balance sheet limitations. To them, Key provides a forced savings mechanism to build wealth toward the stable monthly outlay a home appears to entail. Key works with ORs in default to craft a ‘glide path’ to curing default over time, drawing from the OR’s equity account as a source of cash.
Other aspects of Key include the scale economies it can negotiate regarding ancillary services and its infrastructure around short-term rentals (“STR”). Regarding the latter, for the pool of condos Key controls in a building or given market, Key provides marketing (through channels like Airbnb and Vrbo), revenue optimization, handles payment processing, provides quality control, and provides linens / towels and post reservation cleaning. ORs can also pay for advance cleaning. As Key’s STR brand develops, STR guests should begin to view its room inventory as a professional offering, elevating occupancy and rate. From day one, its offering will allow residents to efficiently maximize utilization. For this offering, Key’s OpCo captures 15% of STR net income, with 15% flowing to asset owners / PropCos, and the remaining 70% to ORs.
Sec 2: How it Works for Asset Owners
Key’s attractiveness to asset owners in the condo/co-op space is largely predicated on technology that enables it to efficiently manage smaller pools of units, attach services, and create economies of scale. However, its ownership management tech may also find broad adoption within the exuberant single-family rental (SFR) space or could enable institutional investors to efficiently enter the 10-100 unit apartment space in dense urban areas. Returns to its set of unaffiliated PropCos depend upon their achieving a higher lifetime value of owner-residents they service (LTV), lower resident acquisition costs and vacancies (CAC), efficient operations, and incisive asset allocation.
Key attracts condo product to attach to its platform by appealing to owners of 10-50 unit blocks or forging deals with developers to acquire blocks in buildings along the spectrum of completion. These blocks are located within a set of approved or to-be-completed buildings upon which it will or has run due diligence and which accord with its acquisition criteria. It may contract with developers pre-groundbreaking (de-risking sellout and perhaps stimulating housing supply) or purchase blocks amidst the sellout process, in either case giving Key-attached PropCos the chance to acquire at a discount due to transaction cost savings and developer risk & return implications. PropCos may negotiate a 5-10% discount to retail price in acquisitions.
Key’s value proposition to owners in the SFR industry is similar and perhaps even more compelling. If the notion of homeownership is even more desirable to families selecting SFRs to ‘nest,’ than it is to renters of condos, Key enables SFRs to simulate homeownership from an investment standpoint as well as that of lifestyle. Key ORs, amassing equity at the same rate as an equivalently leveraged SFR owner, should feel less impetus to rush into full ownership, and may thus turnover with lower frequency. This should differentiate Key-attached SFRs relative to other SFR stock and as above, improve LTV and CAC.
In terms of how Key interacts with estate agents, Key has chosen symbiosis vs. disintermediation, with nearly 15% of current resident placements being by realtor referral. Key pays realtors a half-month’s rent commission when clients move into a Key-powered home (less fee but less work too). Key also refers clients leaving its ecosystem back to the referring agent and shares one-third of any sell-through commission it earns for the eventual full purchase of a co-owned home with the referring agent.
Sec 3: Value for Users

Exhibit 1: Year-over-year home price appreciation has been torrid across several MSAs through C19. Source: CoreLogic’s Housing Price Index, August 2021 year-over-year
Homeownership can be difficult to justify as an investment decision. As a forced savings mechanism, it can help families to amass savings by imposing discipline. However, those same discipline-instilling fixed payments are unyielding in the face of job loss. It can enable a household to stabilize a significant line item in its income statement, but it simultaneously exposes it to CAPEX and repair events. When holistically analyzed relative to renting, it can produce attractive real returns over select periods in select geographies, but the conditions that engender these returns are difficult to predict. Further, outside of supply constrained markets, appreciation tends to be inflationary over longer periods (prices related to construction costs net of obsolescence). Macro conditions notwithstanding, conditions have been propitious in certain supply-constrained markets across North America.
Interest alignment is Key’s most valuable attribute to consumers. That Key and its third-party investors have taken on a building means they have performed due diligence that almost unequivocally extends beyond what an experienced homeowner would perform. Investors’ pari passu exposure to special assessments and extended exposure to each asset impel them to express exceptional care in site selection and physical condition. In terms of structure, Key’s structure closely approximates the risk & return profile one would assume with full ownership, only herein involving less capital and lacking in tax benefits.
Another significant source of value for consumers is Key’s mollification of market timing risk. In contrast to a front-loaded conventional home purchase, buying into a Key home involves dollar cost averaging; one buys in on a monthly basis over years at a valuation that is updated monthly by AVM. In the US, annual home price volatility is approximately 15%. While it seems like prices only increase, per the geometric growth exhibits below, purchasing at a local price maximum can curtail one’s 10-year appreciation prospects. Key reduces the OR’s exposure to this basis risk. If the OR doesn’t try to time the market or grow risk-averse in market retractions, it will automatically buy larger stakes therein. As time unfolds, one’s IRR shifts from a calculation determined by discrete entry and exit points, toward one wherein, depending on the size and invariance of one’s monthly investments, one’s entry point approximates average price level over time, and market timing risk is confined to one’s exit.
From a portfolio management perspective, Key allows residents to retain their investment portfolios while allocating capital to housing through dollar cost averaging subject to a 100bp charge on additional equity invested. Access to an equity line of credit and the low buy-in collectively enable residents to better manage income disruptions. Most first-time homebuyers deplete income statement and balance sheet to fund a down payment, magnifying the damage a job loss could produce. Their capital is allocated to high-leverage, high-volatility positions, wherein they cannot afford the downside. Key also utilizes prudent 50% leverage at a rate below what is available on the consumer market, with ORs sharing in the financial benefit thereof.
To what incremental risks is an OR subject relative to a homeowner? There aren’t other operators that could step into its shoes and efficiently operate blocks of condos or provide a similar offering. As such, Key is structuring its agreements to allow conversion to conventional month-to-month tenancy in its absence. Investors that do not want to operate as conventional apartment landlords can sell, with the OR having the first right and a Key-attached PropCo having the second right of purchase as outlined above. Whereas a dense urban market can absorb a block of 10 – 50 units in building X over the course of perhaps 3-6 months, greater speed or volume would come at the cost of discounted pricing, either to retail buyers, to converters that want to refinish the units and sell them individually, or to another small rental operator. To exit a portfolio of institutional scale efficiently, the investor would need to execute bulk trades, selling portfolios of buildings, individual buildings, or blocks of units to apartment operators or condo converters. Full buildings should be highly liquid while blocks of units could trade at a 25% discount to gross sellout to condo converters. The latter presents an unfavorable downside scenario for large investors, but Key has time to address this risk, which will decline in likelihood as Key achieves profitability.
Sec 4: Value for Society
If you believe in homeownership-for-all, which we discussed at length in Divvy and below in Value for Investors, Key provides an elegant solution. Firstly, in Divvy, I asserted that homeownership is best for those who can remain in one area for 10+ years (high transaction costs), have sufficient stability and income to limit default risk, and who value the freedom to tailor their surroundings unimpeded. Key reduces brokerage fees from 6% of condo value to 1% of OR equity (if 5% of the deal is OR equity, this translates to 0.05% of condo value). Divvy and Key alike reduce a resident’s balance sheet and income statement stress. Homeownership within the Key and Divvy models may thus be appropriate for a broader segment of the population than is traditional ownership, although this doesn’t necessarily mean that homeownership or either model is inherently virtuous.
To advance the impact discussion regarding Key, we could consider its effect on housing prices and the satisfying comparison of Key’s value proposition to ORs relative to that of the traditional high-leverage first-time homeownership model. Enabling thinly capitalized buyers to purchase in JVs with third-party investors could expand for-sale housing demand, but this depends on the extent to which Key’s demand comprises renters currently renting PBRs. The most natural adopters of the Key model are those currently renting condo-quality high-rise product or single-family product, which is to say largely for-sale, investor-owned product. For this group, Key adoption creates no net housing ownership demand but instead converts existing supply from rental to co-ownership.
If Key is in the market for the long run, are fewer highly levered first-time home buyers and more Key ORs a net negative? If Key reaches stabilization, ORs should have a liquid exit at a cost of 100bps on equity, and an ownership model in which they can build equity without the elevated default risk of a high leverage loan. The ancillary income ORs may generate through its STR program enables them to better manage the risk of revenue shortfalls. When Key reaches stabilization, depending upon one’s position regarding “homeownership as social impact,” if its third-party investors aren’t market timing, and Key is able to enter without materially yet temporarily moving the market, Key’s participation could still create societal value while incrementally elevating prices.
Key’s participation in the market could dampen price fluctuations in high growth markets at scale, but I’m not convinced this is manifestly positive. Within its platform, it does not enact bidding wars, instead using AVM tech to set prices. While the AVM still prices based on transactions that may have involved bidding wars, the volume of input data should nullify idiosyncratic deviations, such that prices to ORs reflect general price levels. Sales comps generated by the sale of Key-attached units to ORs could thus reduce the standard deviation of condo sales prices in the broader market. ORs are also not forced to compete against institutional capital or aggressive buyers with all-cash offers; Key instead enables them to invest alongside such investor wherewithal. Is it better for society that these units trade through the protected Key environs, or through auction processes? An auction process should identify the bidder with the highest willingness to pay, a measure of who wants it most (subject to means). While it doesn’t feel good to lose a home based on balance sheet, it makes sense that an astute seller would consider financing risk. Is it less just when the winning bidder isn’t an individual, but PSP-backed Pretium (PSP committed $700m to Pretium in Jan 2021) outbidding an one of PSP’s pension plan participants? Is it more important that a public service worker gets onto the ‘property ladder’ in terms of her primary residence, or that her pension plan is instead invested in that home, such that she can retire (albeit while renting)? Perhaps the answer is that if the home presents a favorable investment, we might prefer that the gross returns thereto are enjoyed by the worker in a pari passu joint venture, rather than the worker receiving the net returns after its pension plan first pays 2% & 20% to Pretium. You might find this answer unsatisfying in that Pretium would on average generate higher pre-tax gross returns from the investment than the worker (scale, timing, asset management), whereas the worker would enjoy attractive tax advantages, yet would not be attempting to max returns.
The net pricing effect of Key’s presence in the market will depend on whether its participation in the market can stimulate enough incremental new supply to offset or exceed its contribution to demand. This may hinge upon when, in the development process, it contracts with developers. If it contracts before developers raise debt & equity, or better yet forms programmatic relationships wherein developers design with Key as part of the mix of uses, it could reduce risk and its corresponding price to developers, enable developers to build more without absorption fears or pay more for land, and potentially reduce downside risk for PropCo investors.
A credit-enhanced contract from Key-attached PropCos to buy units (e.g., if they have commitments from institutional LPs or are otherwise able to aggregate capital from individual investors) could reduce developer sellout risk and marketing & sale costs. Condo sellouts involve significant market risk and can seize up around geopolitical or major economic events. Confining this risk to a subset of the units can increase certainty that the lender and equity partner get return-of-capital, enabling the developer to negotiate a more favorable return waterfall and obtain lower-cost debt. If a developer contracts with a Key PropCo yet still seeks the return / risk profile of conventional condo development, it could opt for larger deals of longer expected sellout (greater risk of encountering a slowdown) before factoring in the PropCo’s advance purchase. This only enhances new supply if the market for larger sites is illiquid, which depends on the submarket’s perceived depth of demand. If the developer is willing to build to a lower expected return given the attenuated sellout risk or can sell a block to a Key-attached PropCo earlier in the project life cycle but without a full present value discount or accounting for marketing savings, it could justify a higher land basis that could enable it to, for example, turn an underutilized commercial site into condos, producing incremental new supply. Developers’ ability, when building a subset for Key, to pay above conventional condo land value depends on how the value created by Key’s reduction of marketing & sale and financing costs is apportioned between the counterparties.
If a Key PropCo contracts at the design phase, it could have the developer build Key product in a partitioned-off section within the building that an institutional apartment investor could efficiently operate. Blocks of condos are less liquid as rental product due to management redundancy between HOA and property manager, and the inability of the block’s owner to directly control CAPEX that instead flows through an HOA. If CC&Rs indicate that a certain block of units is controlled by a separate HOA solely controlled by Key, and allow for an efficient apartment operation onsite, it could provide Key PropCos’ investors with greater expected exit liquidity.
Net-net, I expect Key’s market entry to exert limited upward pressure on prices, with the extent of such pressure being related to its scale and growth curve, and this pressure dissipating in the long run. Initially, it will be managing completed product, buying unsold inventory, and seeking earlier stage partnerships. As it scales, if institutional investors begin purchasing blocks, such that demand intensifies for the ownership of for-sale units, prices should increase. At stabilization, Key’s ability to enable developers to pay more for dirt, and as such to convert non-residential sites to residential, will likely flatten its contribution to the supply / demand imbalance.
In terms of government alignment, the governing Liberal Party has placed $1B behind an initiative to turn renters into owners through grants and loans that will catalyze the development of RTO product. Key’s model is directly aligned with the party’s agenda, which could portend partnerships or supportive legislation, such as tax treatment parity. Should Key be able to qualify its product as ‘affordable’ by the right measures, it may also be able to obtain incentives typically only available for PBR (e.g., low-cost gov’t land, discounted fees, faster and more flexible zoning).
Sec 5: Value for Investors in Key and its Third-Party PropCos
Key’s tech and singular lease structure have application across multiple markets. Its tech enables the efficient management of smaller blocks of units, rendering 10-to-100-unit buildings, typically off-limits to institutional investors due to management inefficiency, investable. The Owner-Resident Agreement is a private co-ownership contract not subject to rental tenancy legislation, making rent and eviction policies privately arbitrated matters. If the latter holds in California, Key’s offering could be compelling to institutional landlords with condo-mapped assets (and a level of frustration with statewide rent control and unbalanced eviction policies). Its tech could also address management inefficiencies in the ebullient SFR space. Key should resonate deeply with SFR renters, who typically stay longer and likely rent due to capital constraints rather than preference. Key’s tech could even create value for owners and residents of conventional PBRs, including through its hotel flag equivalent STR product, which should bolster other income.
Key’s attraction of pension fund capital into its space will likely dovetail with stabilization of its operations, establishment of its track record, and achievement of profitability (to limit probability-adjusted downside to PropCos if OpCo fails), but it could happen sooner. The volume of institutional capital pouring into the SFR space is encouraging for Key, as is the willingness of risk-averse pension funds to take venture formation risk in committing to nascent platforms (e.g., Nuveen’s commitment to invest $400m through newly-formed Sparrow). Distinctions between condos and SFRs (e.g., landscaping, R&M outside the unit’s envelope, locational inefficiencies) could require Key to engage in a patchwork of local partnerships, but the market opportunity justifies the work. With Blackstone, Rockpoint, Brookfield, Starwood (investing through Roofstock), and others allocating to the SFR space with ≥ mid-teens return targets (e.g., Rockpoint is targeting mid to high-teens with 60% leverage in its $375m JV with INVH), Key could first obtain contracts with such moderate to high octane capital sources before building a broader base of institutional capital when its platform and strategy are de-risked.
What about Key should excite hard asset investors? Close alignment of interests between ORs and investors should produce more favorable operational outcomes. The NNN lease structure incents ORs to manage within unit OPEX and CAPEX assiduously. ORs should vacate with lower frequency, such that equilibrium occupancy is higher, and turnover, marketing, and G&A costs are lower, elevating its LTV to CAC ratio. ORs are likely to require more than one three-year term to amass a conventional down payment, but even if they only stay three years, that implies 33% turnover per annum versus 45 – 55% for PBRs. The spread Key can capture by purchasing condo blocks at a discount is significant; it should exceed the capital (if > $0) that Key is putting at risk before being partially or wholly taken out by PropCos. Unlike OpenDoor, Key can flip contracts or likely avoid holding inventory due to longer deal cycles with developers, elevating its return on acquisition capital.
If Key is lining up a pipeline of deals it will close at construction completion, the corresponding discounts to spot pricing depend upon Key’s credit quality and cash flow timing. Key could establish its creditworthiness by amassing commitments from institutions, placing large non-refundable deposits, or obtaining letters of credit. Depending on when (amidst development execution) Key closes, its investors would bear more or less of the types of risks normally borne by joint venture equity, such as construction defects, delays, non-completion, and market risk. If the developer had underwritten to a levered 20% IRR with 60% loan to cost debt, Key could pay 8-12% below the developer’s underwritten sellout pricing, multiplied by the number of years ahead of schedule it pays, without eroding the developer’s IRR. Even if Key simply contracted to buy units at completion at a fixed price but did so before the developer cut JV docs and obtained debt, it would convert a tranche of the developer’s sellout, typically subject to 15% per annum price volatility, into low-risk bond-like payments that should lower the developer’s debt and equity costs.
Risks Key presents to institutional investors today are related to the nonexistence of substitutes for Key’s OpCo, such that in Key’s absence, blocks of condos trade at a bulk discount. If Key were to face solvency issues, it is possible that a large PropCo scaled up around Key-managed units could purchase Key’s tech to continue operating as a vertically integrated platform, although such a vehicle might not offer third-party management to its competitors. Absent this, if Key went insolvent, condo investors would need to convert to apartment operations, which would impair current cash flow and condo block values.
To exit thousands of units across several buildings and 50-100 unit positions within condo towers efficiently, PropCos would need to execute bulk trades, selling portfolios of buildings, individual buildings, or blocks of units to apartment operators or condo converters. The market for whole buildings would likely be liquid, with apartment investors underpinning demand and the ongoing ability to manage them as conventional apartments bolstering value. If for-sale market conditions aren’t auspicious, apartment investors are likely to prevail for single-owner buildings, albeit at a discount to retail condo pricing. Unless housing market conditions are buoyant (an unlikely backdrop for Key’s insolvency) or the discount to gross sellout at which the building is priced is sufficiently deep, converters will not show up. Under normal market conditions, this discount is likely 20-25% (to cover transaction, and incremental hard, soft, and financing costs). In the case of blocks of condos in a building wherein the units are otherwise owned by individuals, converters are the market. Institutions can limit this risk by investing only in whole buildings or new developments wherein they are able to negotiate the CC&Rs to reflect full control over OPEX / CAPEX within a partitioned-off section of the building, such that this block trades with the liquidity of a stand-alone structure (effectively a condominium interest comprised of condominium interests).
Sec 6: Macro & Investment Considerations
We have wrestled with the buy vs. rent decision (see Divvy). Whereas the long-run data we have regarding housing prices, on a national basis, may not encourage home buying as an investment, particularly if said data were to be corrected for CAPEX invested and obsolescence (data is biased toward new product in sellout), certain supply-constrained cities have regularly produced positive appreciation CAGRs (Exhibit 5), and current market conditions are unique.

Exhibit 2: Real building costs and home prices, population growth and long interest rates indexed to 1890.
Source: Prof. Robert Shiller of Yale (from his book Irrational Exuberance; Online Data - Robert Shiller (yale.edu)). Indexed all variables to 100.
National housing market conditions are predicated on the confluence of a set of extenuating circumstances, with a subset of recent trends likely to persist. Circumstances include a construction labor force diminished from the 2008 financial crisis, a decade or more of undersupply, market distortions produced by C19, and the Millennial generation’s late entry into for-sale housing. Conditions buttressing peak pricing in places like Nashville are likely temporary, but in supply-constrained markets, higher-cost production methods necessary to address complex site conditions, NIMBY resistance, and a paucity of undeveloped land are permanent. Construction tech notwithstanding, I don’t see the equilibrium construction cost of urban housing declining materially. It is possible that the tech workforce will, post C19, remain relatively distributed, which would reduce high wage population growth in the urban core, but based on the leasing decisions of the FAANGs, this may not result in prolonged tier-one outmigration so much as incremental growth in tier two cities. According to Zelman & Associates, US organic demographic growth is slated to fall below zero by 2030, whereas US housing starts have been exceeding breakeven (household formation + obsolescence = 1.4m units / annum); national conditions may soften.
Over the long run, US real home price appreciation rates have been flat. Exhibit 2 is based on a dataset compiled by Robert Shiller of Yale; it depicts inflation-adjusted growth in US home prices and construction costs since 1890, with real per annum geometric growth in prices measuring 51bps over the 131-year span (3.2% nominal growth). Note also that real construction costs incrementally outpaced real home prices over the long run (albeit not continuously); prices and costs track each other. In such a monolithic view, the major regional variations underpinning broader price movements prove elusive. Over the long run, a market agnostic approach would have produced inflationary growth in prices, unsupportive of IRRs necessary to attract institutional LPs.

Exhibit 3: Whereas growth had been tapering in 2019, factors related to C19 produced sharper growth than of the pre-GFC housing bubble and the post-GFC recovery. Note: HPI stands for CoreLogic’s Housing Price Index.
Recent macro data, part of the impetus for venture formation in this sector, tells a starkly different tale. US home prices, as tracked by the Case-Shiller Index (Exhibit 3), are up an astonishing 6.6% CAGR over the 10 years ending in August 2021 (7.9% CAGR on trailing 5 years). Note that in this case, base year approximates the nadir of the Great Financial Crisis with the hold period also capturing the (impossible to presage) tailwinds of C19. Whereas growth was waning in 2019, market distortions produced by C19 (preference for SFRs, acceleration in down payment accumulation, interest rate decline, impediments to construction) conspired to propel growth to 18.1% over the past year according to CoreLogic’s Home Price Index (which predicts growth of 2.2% over the next year). If we focus on the eight years following the nadir of the GFC (ending pre-C19), growth was 5.1% per annum.
In a country this large and varied, at any time certain cities are flourishing while others are in decline, which argues for active market selection. If we consider that there exists a mean growth rate for condos nationally, the greater the number of MSAs and hence condo trades in our sample, the less likely that our sample mean will deviate from the population statistic by more than a certain margin (Chebyshev’s Inequality). Exhibit 2 does not imply that condo investors will experience tepid returns from appreciation so much as underscore the importance of market selection.

Exhibit 4: Note the intuitive inverse relationship between the 10-year and Zillow’s index. Observe also San Francisco’s divergence, likely a reflection of tech-driven growth in GDP per capita (worth additional analysis).
Source: Zillow Monthly ZHVI Condo Index ending 6/30/21 (by City)
Variation in real estate values across markets is almost entirely explained by two factors, population density and GDP per capita. In places where income inequality is pronounced, as long as GDP per capita and population density are high, so is the value of real estate (e.g., Mumbai, Hong Kong). Interest rates affect values but in a market-agnostic way. While one should attempt to correct for the effect of the precipitous decline in rates to near zero over the past 25 years (Exhibit 4) when attempting to predict or bound future growth, when determining how to map capital to the markets, one should focus on population density and GDP per capita. Asset allocation for long-duration capital focused on housing should incorporate the evaluation of metrics with predictive power toward changes in these two factors.
To explore this topic empirically, in Exhibit 5 I simulated 10-year appreciation rate CAGRs for the top 30 cities in the US by size, starting with the monthly Zillow ZHVI Condo Index. This index used to represent median sale data, but Zillow now describes it as a ‘typical home value’ metric. If Zillow’s definition is consistent over time, I’m OK with its nebulous description; we are focused on price movement versus level. Condo sales volumes are likely to consist disproportionately of product in sellout, and the data should be corrected for the CAPEX one would have to invest to turn a 10-year-old condo into a new one. I suggest adjusting per annum growth down 1% to account for CAPEX in the following charts.
While Key is initially focused on Toronto, a supply-constrained city experiencing robust economic growth, and could enter cities like Vancouver, BC next, at some point the array of supply-constrained gateway cities in the US comprise an unavoidably large, geographically convenient and culturally similar expansion market. The sample statistics around condo appreciation in markets like New York and San Francisco may also inform our conception of the geometric growth sample space.

Exhibit 5: Note ‘quartiles’ displayed above are demarcated based on a division of the range of observed outcomes into four quadrants of equal length (whereas the traditional usage of ‘quartile’ implies boundaries chosen to divide pool of outcomes into four groups of equal size). Even in supply constrained cities with very strong economic growth, a significant subset of 10-year appreciation CAGRs over the past 25 years have been in the city's respective first quartile. In San Francisco 44% of outcomes were between 1.2 - 3.7% per annum, whereas in San Jose, 35% of outcomes were between (1.8%) and 1.5%. One could likely do better by applying tactical tilts toward cities in which fundamentals are most attractive over time. Secondly, our rigid 120 month hold period conceals the advantage of patience. Five-year hold results involved even wider variation and specifically, if you evaluate San Francisco-focused Exhibit 6, holding a few more years can cover a multitude of sins.
Source: Zillow Monthly ZHVI Condo Index ending 6/30/21 (by City)
There is remarkable overlap between those cities that posted the highest average per annum geometric growth in condo prices over the 181 10-year time segments in the dataset, and those sought after by institutional investors as supply-constrained with growth-oriented economies (San Francisco, San Jose, Los Angeles, New York, Seattle, Boston, and Washington, D.C., which we will denote the “Seven Cities”). For clarity, note that these 181 time segments are not mutually exclusive, but entail overlapping 10-year periods starting on 1/1/1996, 2/1/1996, etc. The average CAGR over these periods corrects for the influence of the base year. Other cities such as Philadelphia, Detroit, and Portland performed well over this 25-year period, but more broadly, population density and GDP per capita appear to be inversely related to downside severity and positively correlated to average growth.
If we assume CAPEX of 1% per annum, Boston, New York, and San Francisco of the Seven Cities noted above endured zero 10-year periods of negative nominal growth over the 25 years of data (before ±10% transaction costs applicable to a conventional condo / home sales and while acknowledging that growth in these cases was supported by interest rate decline). Base year had a tremendous impact on per annum performance, but at this moderately long hold period, asset value declines are anomalous amidst our select group. In fact, the Seven Cities produced similar results in terms of minimum, maximum, average, and median 10-year CAGRs over this 25-year period. Notably, while summary statistics around geometric growth are favorable in these markets, corresponding current returns can be extremely low, such that appreciation may constitute the preponderance of total returns.
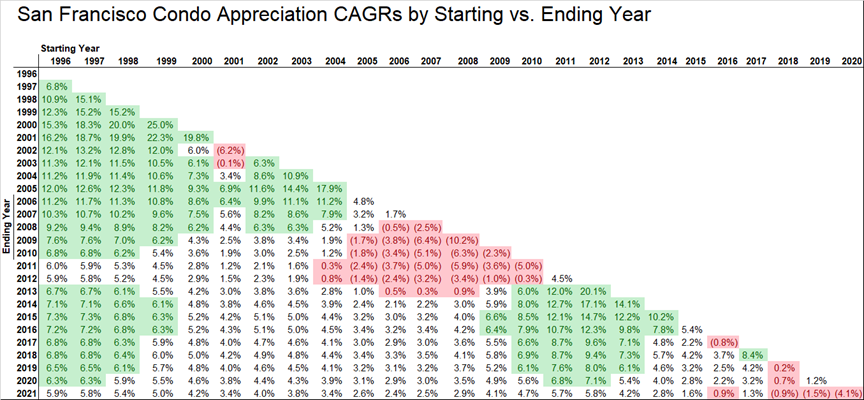
Exhibit 6: This depicts the range and frequency of 10-year CAGR outcomes for SF condos over a 25 year run. Red shading: CAGR < 1%, white shading: 1% < CAGR < 6%, green shading: CAGR > 6%. The frequency of green outcomes is encouraging as is the relative infrequency of red ones. Note that we are transacting different units in every given year. We are counting on the law of large numbers for index prices to reflect mean pricing per annum.
Source: Zillow Monthly ZHVI Condo Index ending 6/30/21 (by City)
Expected returns to a strategy that involves market selection (Seven Cities), but not dynamic allocation between markets, are below what I would expect institutional LPs to accept for the risks (until the model is proven out), but dynamic allocation may sufficiently elevate returns. With Key first calibrating its model with private capital, it may be able to confine the risk institutions bear to those related to housing by the time it extends its offering to them. Returns include 10-15% higher (than conventional multifamily) NOI through services, lower turnover, marketing, and G&A costs, but when we underwrite a 4% appreciation CAGR (net of 1% CAPEX), which only San Francisco, Boston, and Washington D.C. posted in Exhibit 5, a passive strategy produces a high single-digit levered IRR under the presumption that LPs may exit without having to sell condo units at a bulk discount to gross sellout. Core urban multi-housing is trading in the 5-6% unlevered IRR range, which, depending on leverage, is Key equivalent. Dynamic allocation between markets should elevate expected returns and institutional commitments to the analogous SFR space are heartening.
Conclusion
Key’s homeownership product, which addresses a critical issue impacting a large swathe of the population, provides residents with the central attributes (sans tax advantages) of homeownership paired with the most attractive aspects of renting and dollar cost averaging functionality that reduces basis risk. If you believe in homeownership-for-all, Key advances residents toward that goal in an interest-aligned model that provides ORs a path to ownership without the high-leverage risk of a first-time homebuyer program.
Key offers its investors multiple shots on goal. Its co-ownership product offers superior value to residents (relative to RTO or other co-ownership structures I’ve seen) while creating and capturing value in deals with developers, improving resident lifetime value and acquisition costs, and engendering OPEX efficiencies. Its ownership management tech could secure adoption in the SFR or middle-market multifamily spaces. Risks include that attracting institutional capital may depend on its ability to isolate investors from platform risk and that LPs may not adopt early enough for Key to scale, although analogues from the SFR space are encouraging. Regardless of its path to amassing inventory, it should attract significant consumer demand.
Footnotes
Homeownership Sans Tax Benefits (Secs 1, 3, 4): Key does not offer homeownership equivalent tax benefits in Canada, although it is pursuing tax treatment parity and expects to achieve it in the nearterm. While an apples-to-apples comparison against high leverage first-time homebuyer programs should consider return differences attributable to the tax overlay, Key is not yet active in the US and I have insufficient exposure to Canadian tax law to assess them. Without the ability to avail themselves of said tax benefits today, the question is whether ORs are better off renting a condo and investing in a diversified portfolio rather than utilizing Key. With Key requiring only 2.5% down, ORs may still retain a diversified portfolio while investing a sliver in housing. Its dollar-cost-averaging investment mechanism and fee efficiency are such that I don't see a strong argument against Key in this context.
HOA CAPEX Funding Complexities (Sec 1): Condo owners, particularly in older buildings, can span the spectrum of disposable income, expected residency duration, and ability to delay gratification. Some would proactively invest to cure downstream capital issues whereas others prefer to hope they aren’t around for the reckoning.
Does Homeownership Present Stable Monthly Outlays (Sec 1)? I’m not saying homeowners always or often receive the stable monthly outlay part of the trade. Ownership can entail unexpected CAPEX (roof & siding replacements, appliance repairs, plumbing, wood rot), floating-rate mortgage adjustments, or devaluation (e.g., large employer leaves town).
Institutional Capital (Sec 5): Key can remain asset-light, but like Cadre, might consider a backstop from a large investor that believes in the strategy. Said investor would, for some spread, be willing to be contractually bound to close on Key's presale deal flow, should Key not otherwise be able to assign the sale contracts to third-party PropCos in advance of condo completion.
Retail Condo Pricing (Sec 5) Renters that can afford rental rates that justify condo-quality finishes can generally afford to buy, such that it can be difficult to achieve rental rates sufficient to justify such high quality product at scale (demand flows to ownership). Counterexamples exist in SF, LA and NY wherein developers such as Related and Hines have build condo-spec apartments and done well.
Pertinent Questions Regarding Market Selection (Sec 6):
- How is the geographic dispersion of the tech sector changing?
- What is City X’s industry composition? Should one expect these industries to prosper and prosper there in particular? Will they do so in a way that enhances GDP per capita?
- Migration patterns tend to be stable over longer periods of time; what do they portend?
- Where is City X in its evolution? How will the next 25 years be different from the last?
- What factors constrain supply in this geography? How might the macro overlay influence economic factors in City X?
***
Certain information contained in here has been obtained from third-party sources. While taken from sources believed to be reliable, Rampart Ridge, LLC has not independently verified such information and makes no representations about the enduring accuracy of the information or its appropriateness for a given situation.
This content is provided for informational purposes only, and should not be relied upon as legal, business, investment, or tax advice. You should consult your own advisers as to those matters. References to any securities or digital assets are for illustrative purposes only, and do not constitute an investment recommendation or offer to provide investment advisory services. Furthermore, this content is not directed at nor intended for use by any investors or prospective investors, and may not under any circumstances be relied upon when making a decision to invest in any fund managed by Rampart Ridge, LLC. (An offering to invest in a Rampart Ridge, LLC fund will be made only by the private placement memorandum, subscription agreement, and other relevant documentation of any such fund and should be read in their entirety.)
Charts and graphs provided within are for informational purposes solely and should not be relied upon when making any investment decision. Past performance is not indicative of future results. The content speaks only as of the date indicated. Any projections, estimates, forecasts, targets, prospects, and/or opinions expressed in these materials are subject to change without notice and may differ or be contrary to opinions expressed by others.